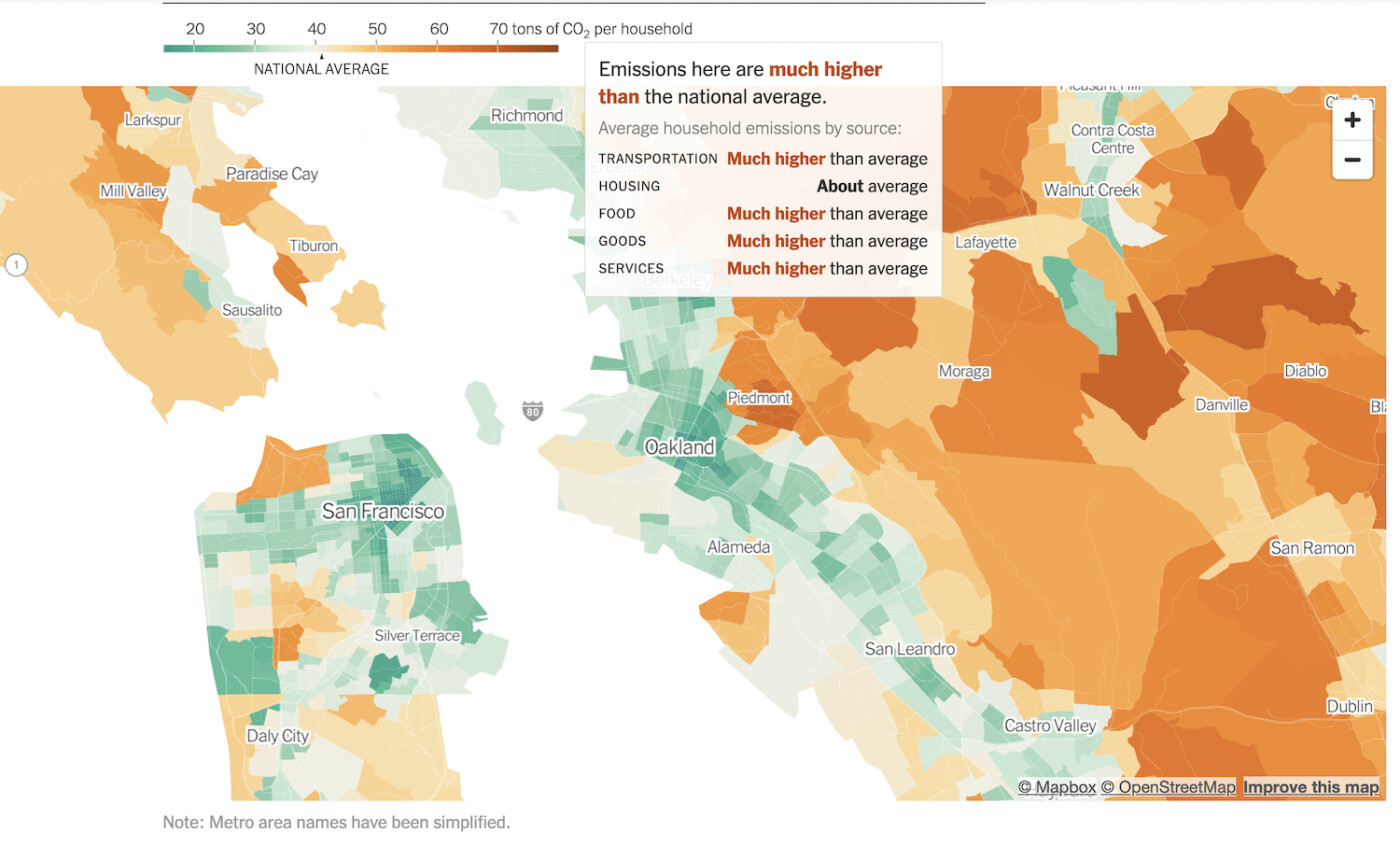
An interactive data journalism article in the Dec. 13 New York Times maps the climate impact of neighborhoods across the country. Piedmont, according to the mapping project, keeps company with other affluent suburban communities that have the dubious distinction of having some of the highest emissions footprints in the nation.
The maps are based on research from the University of California, Berkeley that estimates what are known as consumption-based emissions. The data was produced by EcoDataLab, a consulting firm partnered with the university.
The researchers used a model, a simplified mathematical representation of the real world, to estimate the average household’s emissions in each neighborhood based on electricity use, car ownership, income levels, consumption patterns and more. Driving and housing are frequently the largest contributors to a household’s carbon footprint, although what people eat, what they buy and how often they fly are also important factors.
From The Climate Impact of Your Neighborhood, Mapped
The City of Piedmont has been engaged in a years-long effort to encourage residents to take steps to minimize their carbon footprint. Those efforts include updating local building requirements designed to bring energy savings and reduce natural gas use in the city, among other things.
In July, the city’s sustainability program manager Alyssa Dykman said that unless more action was taken, Piedmont was not on track to meet Climate Action Plan 2.0 goals the city established for itself in 2018 to reduce greenhouse gas emissions 40% below 2005 levels by 2030 and 80% below 2005 levels by 2050. (See article below for more details about Dykman’s presentation.)
