Do the Californians who have been vaccinated to ward off COVID-19 reflect the state’s racial and ethnic diversity? It’s too soon to tell. County data provided by state officials is incomplete.
Yet the existing data does give us a snapshot of who has been vaccinated first: White people have received the largest percentage of doses in nearly all counties. Included are those — such as Orange, Riverside, San Bernardino, Fresno, Madera, Monterey, San Joaquin and Kern counties — with large Latino populations.
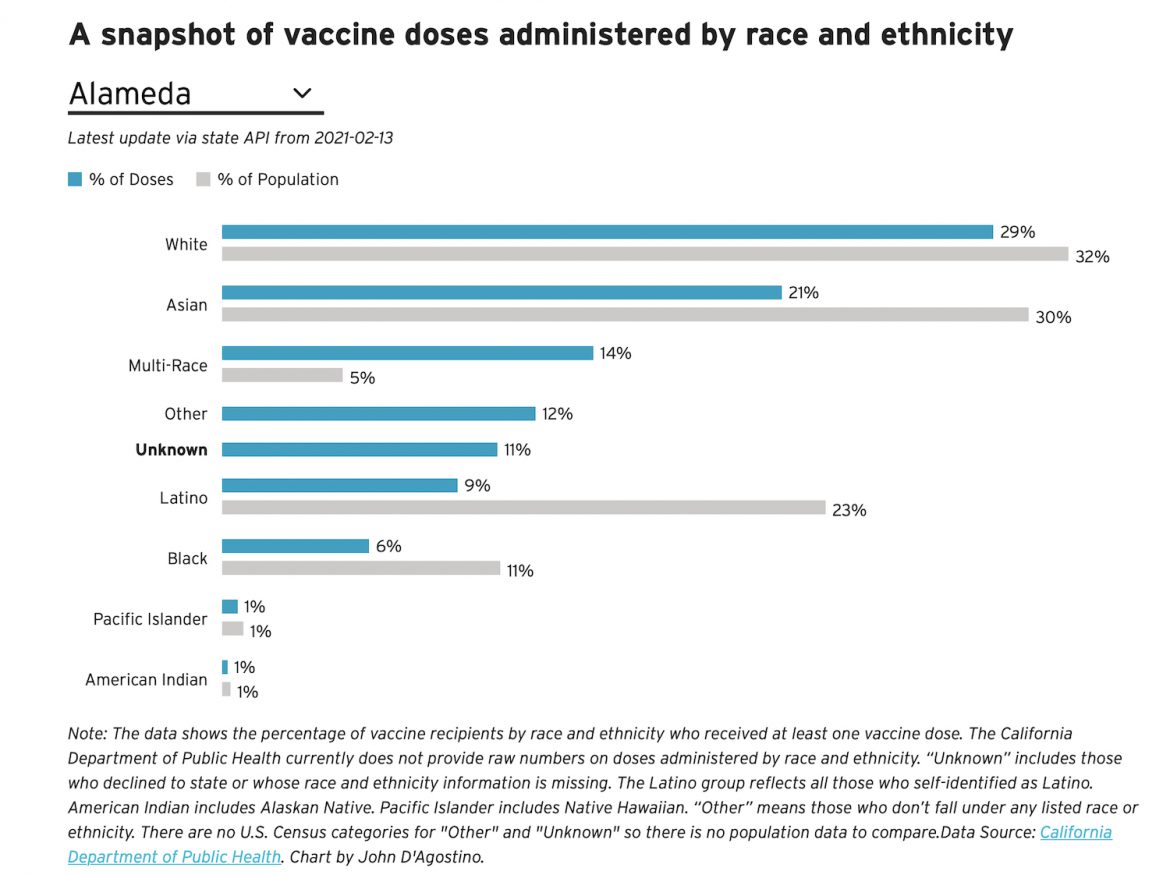
So far, most counties have administered vaccines only to people 65 and over and health care workers. That is likely a big part of the reason why the breakdowns of vaccines do not reflect the counties’ overall racial and ethnic backgrounds. More than half of older Californians are white, according to the Public Policy Institute of California.
In three counties — Los Angeles, Imperial and Kings — Latinos make up the biggest percentage of doses, although at a rate lower than their overall share of the county population. In two counties — San Francisco and Santa Clara — Asians have received the most vaccines. Black people in nearly every county make up a smaller percentage of vaccinated people than their total share of the county population.
However, there are a large number of “unknown” races and ethnicities, which skews the data for nearly all counties. Some, such as San Luis Obispo, Alpine, Mariposa and Calaveras, have such an outsized portion of unknowns that it is a larger percentage than any racial group.
Warning signs of inequity
But advocates worry about early warning signs of inequity. They say that state officials have sacrificed equity for speed in administering vaccines.
“We feel like our communities are being once again overlooked,” said Rhonda Smith, executive director of the California Black Health Network. “It’s nothing new, but it’s disappointing. This is our reality and why we do the work we do.”
In 16 states (not including California) that have reported race and ethnicity in their data, Black people and Latinos were vaccinated at rates lower than their share of population, while white people were vaccinated at rates higher than their share, according to a Kaiser Family Foundation analysis.
Anthony Wright, executive director of the advocacy group Health Access, points to the barriers some marginalized groups face in getting access to vaccination sites: “technology, transportation and time.”
People seeking vaccinations often need access to the internet, cars to get to a clinic and the time to spend hours seeking an appointment. Some sign-up sites only offer English.
As more data comes in, CalMatters will update these county breakdowns, which should eventually offer a more complete picture of the people who are being vaccinated.
“Our rhetoric about equity and inclusion is strong in this state, but will we ultimately stand by those words?” Dr. Anthony Iton, senior vice president of the California Endowment, asked in a September commentary for CalMatters.
CalMatters.org is a nonprofit, nonpartisan media venture explaining California policies and politics.
The post Who’s getting vaccinated in California? A county-by-county look at racial data appeared first on Local News Matters.