
The following weather commentary is from climate scientist Daniel Swain, aka @weather_west on social media. Swain studies the changing character, causes, and impacts of extreme weather and climate events on a warming planet–with a particular focus on the physical processes leading to droughts, floods, and wildfires. He holds a PhD in Earth System Science from Stanford University and a B.S. in Atmospheric Science from the University of California, Davis. His full curriculum vitae is available here.
A quick recap of the forecast vs real-world evolution of El Niño 2026 thus far
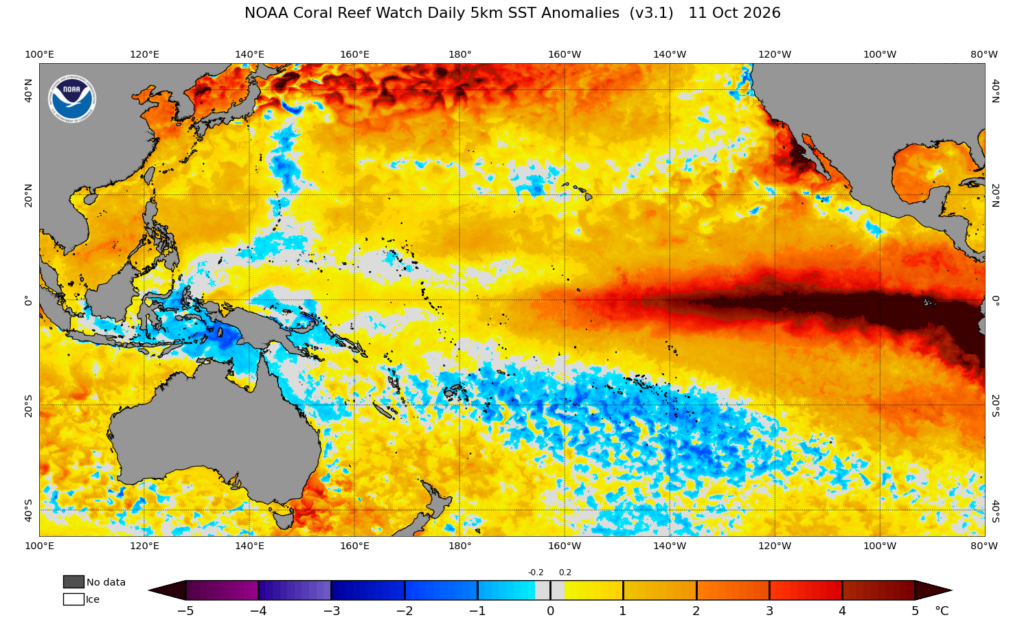
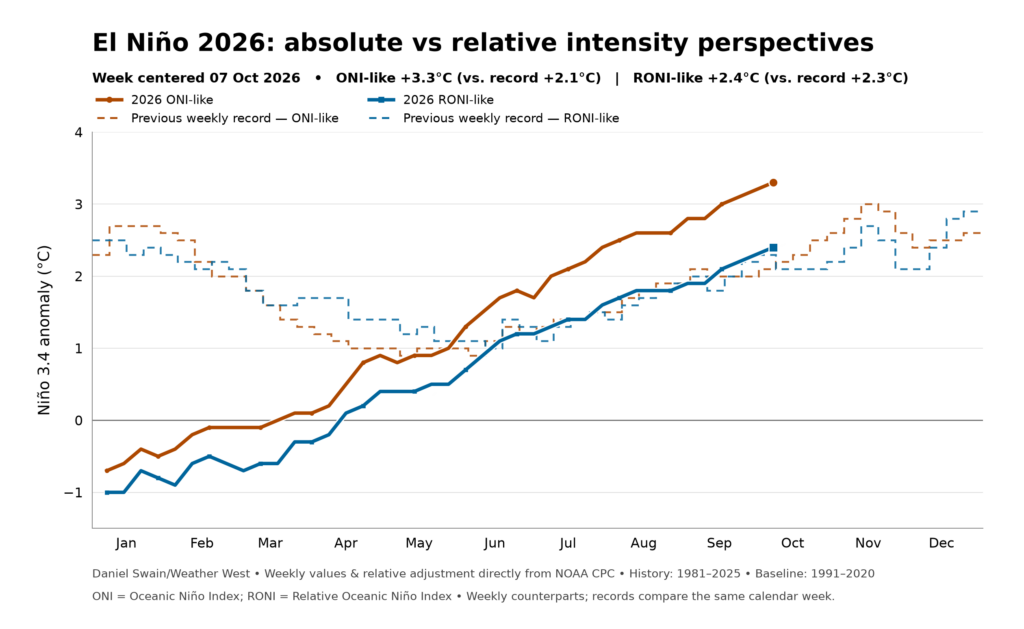
An El Niño event officially developed in the tropical Pacific Ocean earlier this summer, and it has strengthened almost continually since that point. In fact, as of mid-October, the 2026 El Niño event has already become the strongest on record by almost any metric. This includes, for instance:
- Oceanic Nino Index (weekly ONI): Strongest on record by wide margin; currently +3.3°C (vs. record +2.1°C)
- Relative Oceanic Nino Index (weekly RONI): Strongest on record by narrow margin (statistical tie); +2.4°C (vs. record +2.3°C)
- ENSO Longitude Index (ELI): Easternmost on record by a wide margin; 191.5°E (vs. record 178.5°E)
These numbers remarkable in their own right, but even more notable is that they were foreseen months in advance–by many predictive models, as early as mid-spring. I started talking about the (uncertain) potential for a big event in April, then wrote a special Weather West report in June as confidence jumped considerably, and have subsequently been offering dedicated monthly video briefings. We often talk about the Spring Predictability Barrier–a window around May/June prior to which reliable ENSO predictions have historically been difficult due to complex Earth system feedbacks–but this year nearly all major predictive models latched on to a very strong ENSO signal quite early, stuck with it, and (as of October) have now been largely validated. Purely physics-based models explicitly predicting a historically strong El Niño event 6 months in advance, and then having that prediction verify, is genuinely pretty amazing. Notably, California impacts thus far have also paralleled early expectations: Near-shore water temperatures reached record levels, with record-breaking coastal humidity and humid heat in late summer across most of SoCal; unusually elevated ocean water levels have begun to cause increasingly significant and damaging coastal erosion and flooding; and multiple tropical storms/hurricanes have at least indirectly affected central and southern parts of the state since July.
Will this excellent predictive model performance continue into winter? Well, while there is of course no guarantee that’s the case, it’s pretty clear this year’s extreme El Niño event has been well-handled so far, continues to follow a trajectory close to that simulated in the multi-model ensemble average, and that real-world observations continue to suggest that further strengthening is (as predicted) indeed likely.
El Niño is still strengthening, with peak intensity expected around Nov-Dec (but peak impacts lag)
Despite some social media consternation, El Niño is clearly still strengthening. There have been, and will continue to be, weeks-long oscillations on the overall strong upward trend of equatorial East Pacific ocean temperatures as various El Niño-related processes play out, including the interplay between westerly wind bursts (WWBs) and wind-evaporation feedbacks play out. WWBs are, you may recall, a key process in triggering and strengthening an El Niño event; as they unfold, they can actually induce temporary local ocean cooling as evaporation causes heat loss from the immediate ocean surface, but the net effect (7-14 days later) is actually net warming as upwelling is further reduced and warm surface waters are advected even farther east.
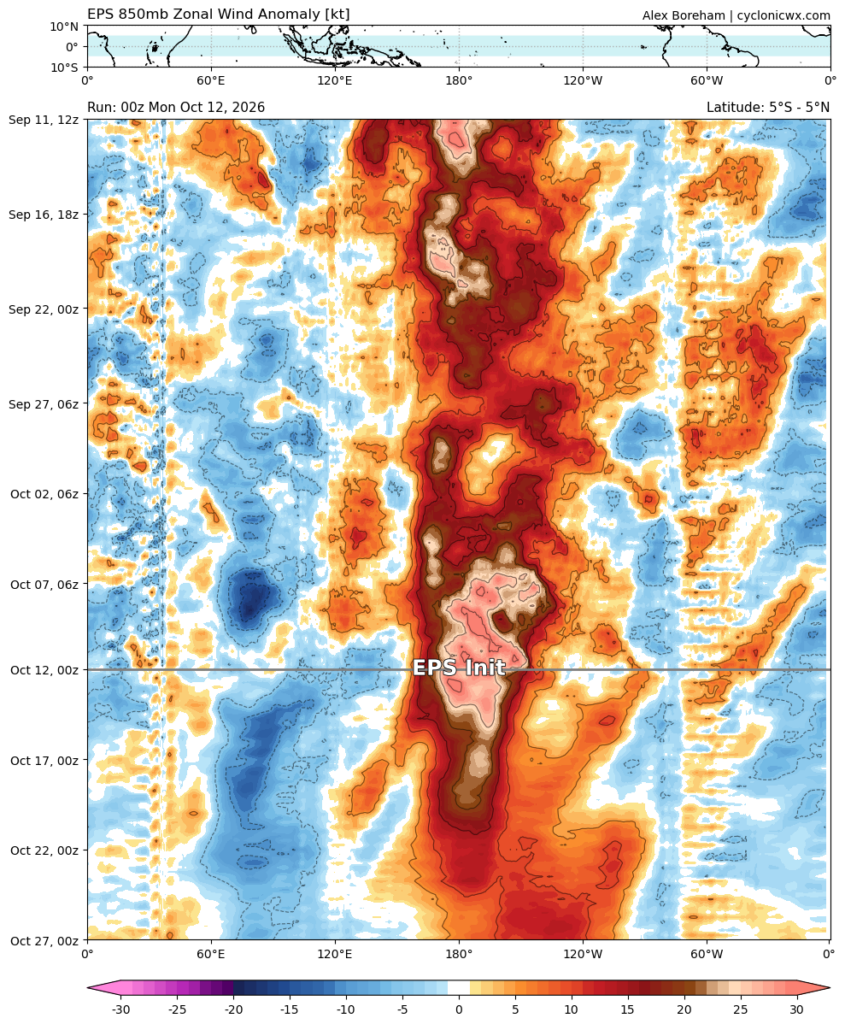
This very process, in fact, seems to be playing out once again as Nino 3.4 region SST temporarily level off during yet another very strong WWB; this WWB will ultimately serve to reinforce El Niño’s existing extreme intensity and likely cause it to peak yet higher in the coming weeks as tropical upwelling is further inhibited. The current WWB is expected to persist for the next 2+ weeks, and may even entail an absolute reversal in the direction of prevailing tropical winds (i.e., these aren’t just weaker than usual easterlies, but may ultimately become westerly winds instead). This is exactly what we’d need to see to give El Niño that last shove into record-shattering territory (irrespective of metric), and it now appears that this is actively underway.
Forecasts continue to suggest El Niño will peak in intensity sometime between later in November and January, most likely in December. Thus, we likely have at least 1 month, and maybe 2, for additional additional strengthening. But peak regional to global impacts from El Niño are usually delayed relative to the peak intensity of the event itself, and this is likely to be true in California and broader U.S. Southwest this winter. When it comes to storm track and precipitation implications, the signal only barely begins to emerge by November, and quite plausibly not until December. Once present, that strong signal will likely persist well into 2027, likely through at least March.
Accordingly, there remains little physical or statistical connection between autumn (Sep-Nov) precipitation and even an extremely strong El Niño event. Do not be surprised if October, and even November, are fairly unremarkable with respect to storm activity in California and the Southwest; it could be wet, it could be dry, and right now there’s just not much signal either way. But what happens this autumn has no bearing whatsoever on what is increasingly likely to occur this coming winter.
In other words: This meme is a surprisingly accurate scaled depiction of the magnitude of the 2026 El Niño event vs the 1997 event *if using the absolute index.* But if using the relative index, Danny DeVito is currently the same height as Arnold Schwarzenegger. And either pairing is striking… ?— Daniel Swain (@weatherwest.bsky.social)2026-09-30T20:25:57.508Z
The extreme 2026 El Niño event will exert a profound influence on California and SW U.S. winter weather
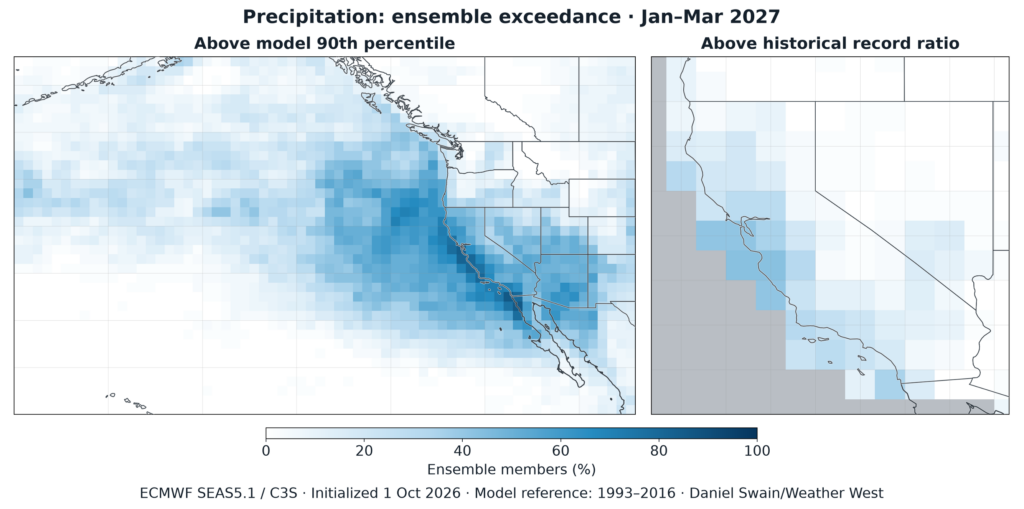
While it’s true that the “tilt in the odds” toward a stormier and wetter California winter during El Niño is decidedly modest during weaker events, this year’s El Niño is far from ordinary. Amid an El Niño that will become the strongest, and also easternmost-centered, event on record (if it isn’t already), this year’s tilt in the odds toward wet and stormy conditions in California will be profoundly unsubtle.
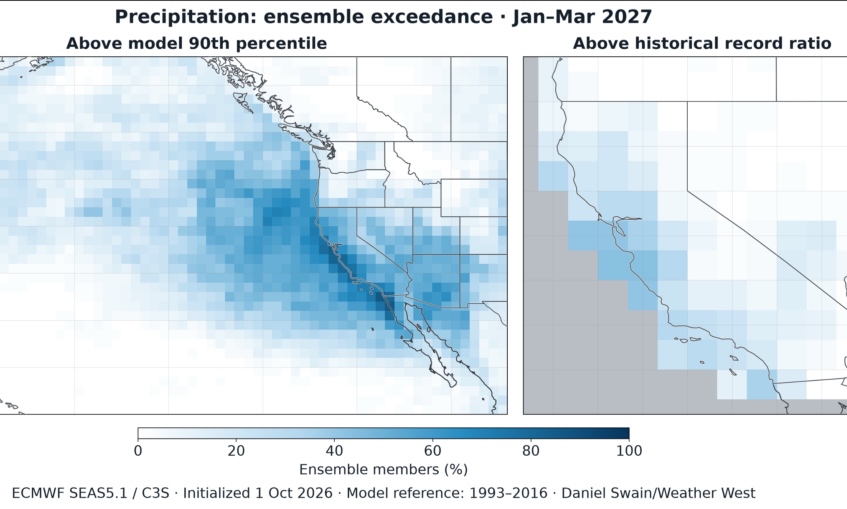
Indeed, the very latest seasonal update from the international multi-model “superensemble” reflects this quite dramatically. Quite frankly, I’ve never seen anything like it before (and I do not say that lightly!). I’ve spent quite a bit of time over the past couple of weeks crunching the numbers and commiserating with other experts in the El Niño space, and here are some key points from my own quantitative and contextual assessment:
- The likelihood of a wetter than average winter in California is extremely high by historical standards (odds >90% statewide)
- The likelihood of an extremely wet (top 10%/90th percentile) winter are are much greater than usual (~5x background odds)
- There is a greatly elevated risk (around ~20x background likelihood) of a record-wet season, and/or individual record-wet months
- High confidence wet signal extends farther north along CA coast and inland vs typical El Niño; highest confidence region includes San Francisco Bay Area/Sacramento region and points south
- Peak California impacts will be from December through March, and January & February may feature highest likelihood of extreme wet conditions
In general, strong El Niño events influence winter precipitation in California and the broader American Southwest by shifting the Pacific storm track for several months during the peak of the wet season. The Pacific jet stream, during a “classic” strong El Niño event, is typically both stronger and positioned (on average) farther to the south in the far eastern part of the North Pacific basin–a so-called “jet extension” that can keep California’s “storm door” open for weeks or months on end. (Technically, El Niño both strengthens the true subtropical jet in general by amping up the Hadley Circulation, and also the southern/subtropical branch of the subpolar jet–both of which can effectively merge near or over California during major El Niño events and amplify storminess.) In other words: The main El Niño influence on California precipitation does not depend on extratropical North Pacific Ocean conditions at all–it is essentially a “ripple effect” from the shifted location of deep tropical thunderstorms thousands of miles away along the equator.
But the very strongest El Niño events, especially when combined with more localized ocean warming closer to the California coast, can further amplify those winter storms that do arrive on California’s doorstep via a secondary mechanism. That’s because warmer oceans mean greater potential evaporation, and therefore more intense potential local precipitation if conditions are otherwise favorable (as during a major winter storm). Since many of California’s largest precipitation events are associated with atmospheric rivers, and atmosphere rivers are definitionally “water vapor in motion,” it stands to reason that a very strong El Niño event (which increases westerly winds) combined with an extreme nearshore marine heatwave (which increases lower-level water vapor) might combine to generate particularly intense atmospheric rivers and to “juice up” winter storms overall. There can also arise, at times, a self-reinforcing feedback process whereby heavy precipitation sustained by intensive condensation within a storm results in enormous latent heat release–heat release which lowers surface pressure, strengthens the storm, and begets even more precipitation (i.e., a so-called diabatic feedback to winter storm intensity).
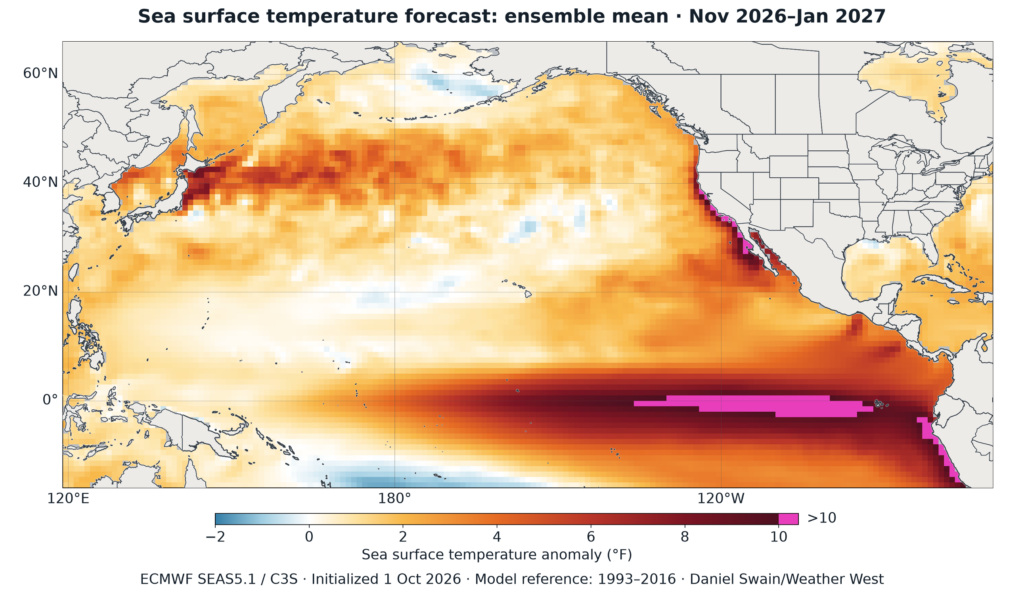
This winter, the seasonal predictive models are indicating the potential for a truly extreme marine heatwave along the immediate California coast. Water temperatures are, already as of this writing, near or above record warm levels along the California coast from about Santa Barbara south and east; these anomalously warm waters are very likely to spread farther north along the Pacific coast later this autumn and into the winter. In fact, the ECMWF ensemble is currently suggesting that water temperatures along essentially the entire California coast will average around 8-10°F above average this winter! These are, again, pretty astonishing numbers, and would blow records from 1982-83, 1997-98, and 2015-16 right out of the water.
In addition to (alas) potentially very serious marine ecosystem impacts, these extremely warm near-shore waters will likely add considerable additional moisture to incoming winter storms (remember: the Expanding Atmospheric Sponge Effect applies both locally and in the short term; it isn’t just a climate change paradigm). They will also, in all likelihood, increase the temperature of inbound moist Pacific airmasses to an even greater degree than would otherwise be the case, raising the potential for warmer precipitation events all the way inland across California’s mountains and perhaps even across parts of the interior West at times. There is even the potential for such anomalous ocean warmth to boost the level of atmospheric instability that will be present during storms this winter and into the spring–perhaps conspiring with the increased strength/prevalence of the overhead subtropical branch of the Pacific jet to increase the risk of coastal thunderstorms, and even the risk of severe convective weather like torrential downpours/flash flooding from narrow convergence lines, damaging straight-line wind gusts, and even isolated tornadoes under the right synoptic weather conditions.
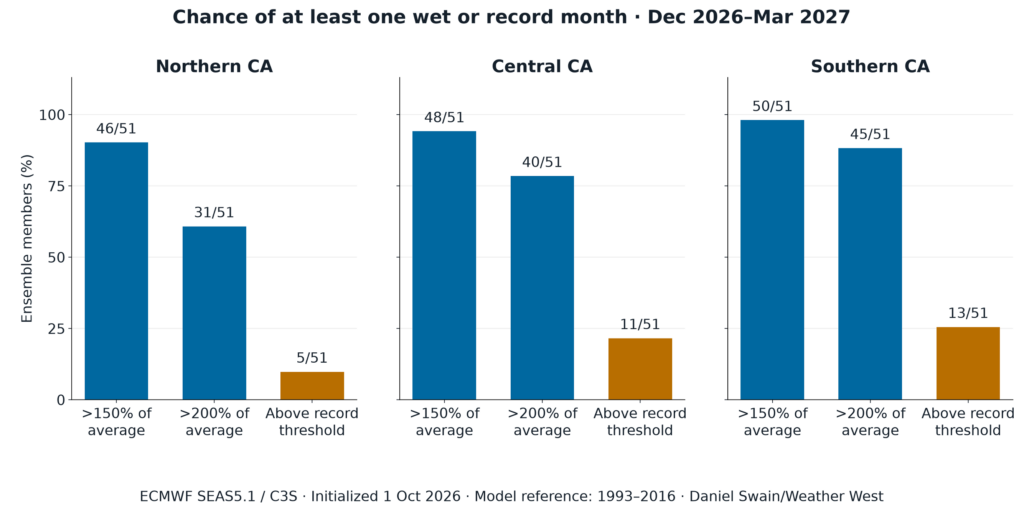
Comparing the most recent seasonal model predictions from October to those from September, the outlook is actually even wetter and higher confidence than before. Seasonal predictions are inherently probabilistic, rather than deterministic, even during a historically strong El Niño event. That means that we can never be 100% certain of what is going to happen–even if we had theoretically perfect predictive models (mathematical chaos, and the Butterfly Effect, in action). Technically, a dry winter is still possible, though it is very unlikely (in my estimate, 5-10% or less). But this year’s numbers are striking precisely because is so difficult to achieve high statistical confidence in this kind of domain. And as a weather and climate scientist who has devoted a career to studying the risk of extreme events in California, this winter’s outlook implies that warning lights should be flashing. There are quite a few individual members of the global ensemble depicting record-wet conditions at seasonal scale, and/or during one or more individual wet season months, in California. Using the 51-member ECMWF ensemble as a reasonably representative example, most coastal locations are depicted as having a 10-20% risk of a record-wet winter (vs a period of record going back over 100 years); in a few locations along the Central Coast, the odds are depicted as being as high as 40-50%. Relatedly, the ECMWF ensemble odds of at least one extremely wet (>200% of average) month are very high: ~90% across southern California, ~80% across central California, and ~60% across northern parts of the state.
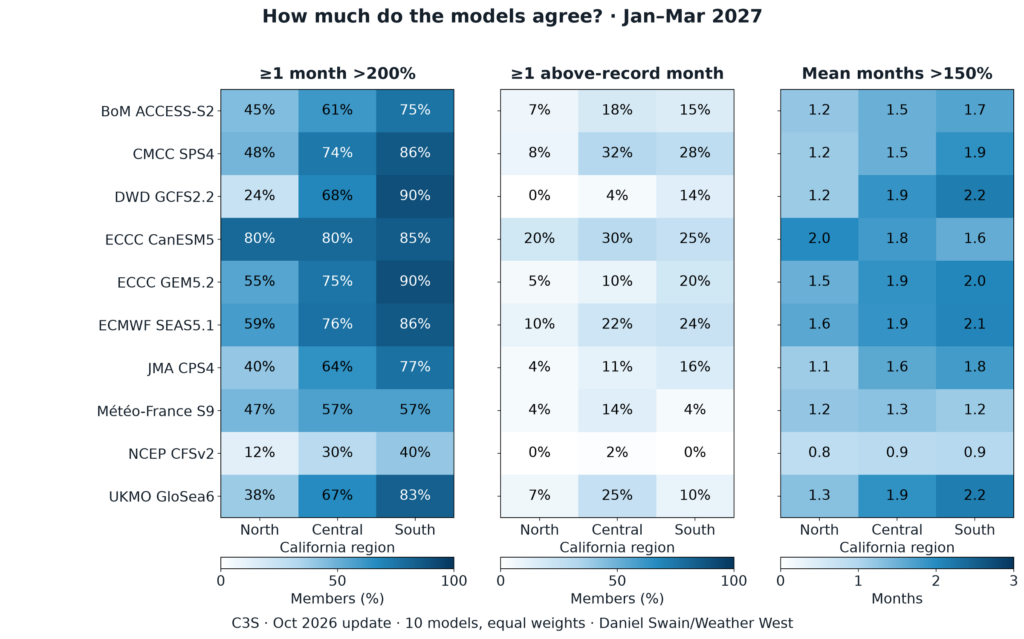
Now, I want to be clear: Please do not take these specific single-model ensemble odds of record-wet conditions literally! Seasonal predictive ensembles are often underdispersed, meaning that they cluster a little too tightly around a narrow range of values (here on the extreme wet side). But I wanted to share these kinds of statistics for awareness. While it is not presently, and will not be possible in the future, possible to explicitly predict whether record wet conditions will occur this winter in California, it is clear that the odds are far higher than background (perhaps by a factor of 20 or more).
There are lots of questions surrounding what this year’s snow season might look like in the Sierra Nevada and points east. This is a tricky one, because there are conflicting precipitation versus temperature signals. On one hand, there is quite a high likelihood of above average precipitation Sierra-wide this winter (especially central/southern Sierra), but on the other hand is there’s also a strong warm signal (especially during the first half of winter, and to lesser extent during latter half). That means that despite a high likelihood of abundant precipitation, there is also a good chance it will most often be falling as rain, rather than snow, at lower to middle elevations much of the time. So while this is a tricky forecast, my general sense is that this year will be one with very strong elevational dependence: Locations at relatively high elevations (7-8k feet and above) will likely do quite well and see a lot of “Sierra Cement,” but the far more extensive region at somewhat lower elevations may end up quite wet but too warm on average to maintain a significant snowpack. So it’s quite possible that much of the Southern Sierra could see a huge snowpack this winter, but that’s mainly because elevations are much higher on average at the southern vs. northern end of the mountain range. As for the Tahoe Basin: The answer may depend greatly on exactly how high up the slopes one goes; it might be a fairly rainy winter at Lake level, but quite a snowy one indeed at the top of the highest ski resort chairlifts.
Increased coastal flooding already occurring, and will rise yet further; increased inland flood risk begin around December
As Newport Beach faces street flooding caused by elevated tides and high surf, officials are urging the public to avoid the Balboa Peninsula area. Authorities said people should not drive through flooded streets.— Spectrum News 1 SoCal (@spectrumnews1socal.bsky.social)2026-10-09T18:30:15.023Z
As anticipated, ocean water levels along the California coast from the US/Mexico border northward to at least the San Francisco Bay Area are already running 1-2 feet above astronomical tidal predictions. This is thanks to a combination of thermal expansion of sea water from the extreme marine heatwave (6-10 inches) plus additional water piling onshore from a large coastally-trapped Kelvin wave (another 9-12 inches) combined with global warming-induced sea level rise (SLR) since the last tidal datum epoch update (2-3 inches, on average, since 1983–2001 atop the 6-8 inches of existing SLR “baked in” to that datum). That has been producing widespread, and sometimes significant/disruptive/damaging, beach erosion and coastal flooding. Notably, over the past week, nearly the entire Balboa Peninsula was inundated at a depth of up to 2-3 feet locally; multiple coastal homes and other structures have been damaged or destroyed along the Los Angeles County coast (most dramatically in Long Beach) by large, battering waves riding atop sea levels nearly 2 feet higher than usual.
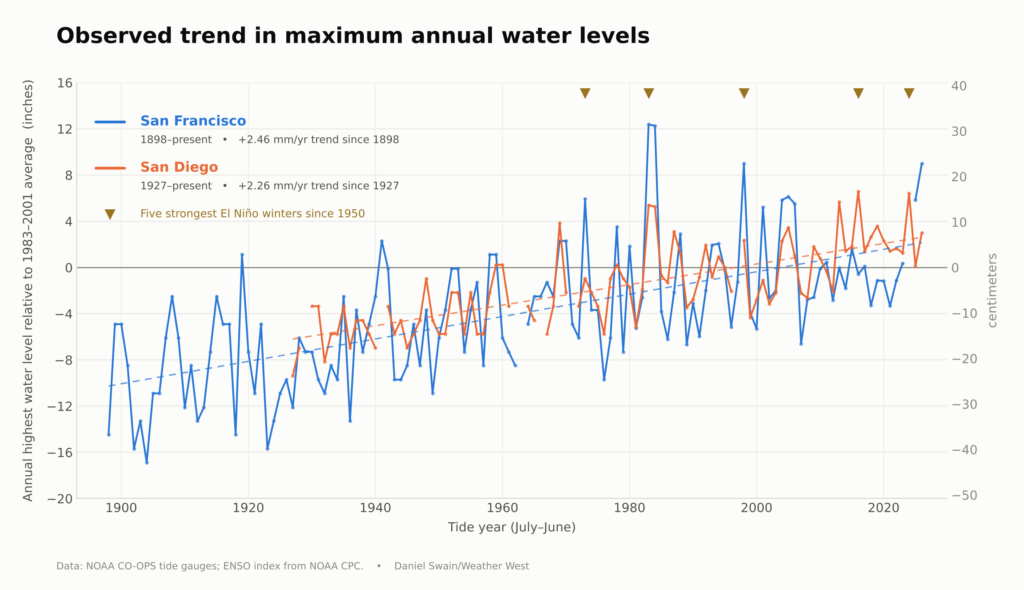
Unfortunately, it’s likely that recent events are just the beginning. Additional, and perhaps even larger, coastally trapped Kelvin waves will likely arrive through the winter, resulting in episodic surges in ocean height near, or even higher than, present levels. Thermal expansion of seawater will persist, and perhaps even amplify a bit as near-shore anomalies grow. But the bigger concern is just persistence of current sea level anomalies into king tide and winter storm season. We already know when the highest king tides will occur in California: November 24–26, 2026, December 22–25, 2026, and January 20–23, 2027. Unfortunately, all three of these (and particularly the first two) overlap directly with both peak winter holiday travel season and also peak winter storm season.
Heavy surf, red-tagged homes, a battered boardwalk: Long Beach confronts costly climate reality— Los Angeles Times (@latimes.com)2026-10-12T01:11:03.129Z
Between November 2026 and January 2027, I would anticipate multiple significant coastal flood events that are worse in severity and also much more widespread than what we are currently seeing. This will affect all of coastal and coastally-connected California, including the interior coastlines of San Francisco and other bays/coastally-connected estuaries. Given continued and/or further increased background sea level elevation due to the extreme El Niño event and associated thermal expansion/Kelvin wave activity, that means that actual water levels during king tides this year will run at least 1-2 feet above NOAA predictions, which do not account for current oceanographic conditions. And that’s assuming it’s a clear, sunny day with minimal winds. Even a moderate storm could bring water levels higher still, and a strong storm would likely produce widespread damaging, and probably historic, coastal flooding. So while my fingers are tightly crossed that we see no moderate-strong storms with onshore flow/storm surge during the king tide windows this winter, appendage superstition is no substitute for preparedness and rapid response.
To that end: My colleagues and I at UC ANR are actively developing a consolidate set of resources that may be useful in planning for, and managing the potential hazards associated with, our historic 2026 El Niño event. This page will be updated as additional resources become available and as conditions change in the coming weeks.
What about global warming, the Pacific Decadal Oscillation, the Quasi-Biennial Oscillation, and more in context of this year’s record-breaking El Niño?
There is a lot of social media discussion surrounding El Niño at the moment, and some of it ranges from contextually misleading to objectively incorrect. A sampling of such claims: that the El Niño event is now weakening (in fact, the opposite is true); that the 2026 El Niño is unremarkable in a historical context (on the contrary, this event is already tied for, or exceeding, depending on metric, record intensity); that El Niño doesn’t matter for California because 2015-2016 “was a bust” (while 2015-2016 was, indeed, not an exceptionally wet winter in California despite featuring a very strong El Niño event, there were countervailing factors then that do not apply this year; also, this year’s event is much warmer); that El Niño does not increase California flood risk (while it is true that many of California’s worst regional floods occurred during non-El Niño years, historical insured flood losses are indeed higher during El Niño years and there is abundant evidence to suggest that risk of major floods is much higher than usual during very strong events in particular); and that global warming has so disrupted global climate patterns to make the effects of this year’s El Niño event essentially unknowable (while climate change does affect El Niño impacts, the primary mechanism of storm track shifts induced by a very strong El Niño is largely robust to background warming).
There is also another set of arguments that do require a bit more explanation. Many have pondered: What other global climate influences and ocean oscillations might affect the regional manifestations of El Niño 2026-2027? Chief among these are concerns surrounding the potential for the Pacific Decadal Oscillation (PDO), which is presently in a moderate cool (negative) phase, to somehow counteract the effects of our extreme El Niño event. I’d respond to this by first offering a reminder that unlike ENSO, the PDO is not–in itself– a primary global climate driver. It is, instead, a broadly useful statistical construct–an index, based on spatial statistics of North Pacific sea surface temperatures (SST) that helps to characterize decadal-scale variations in North Pacific ocean and climate conditions. It is now widely believed among ocean and climate scientists that the PDO is, to a large degree, integrating the accumulated ENSO signal over years and decades along with associated local to basin-scale ocean-atmosphere feedbacks arising from that first-order ENSO forcing. As such, it is a lagging (vs leading) indicator, and does not have a great deal of predictive value under conditions of rapidly-evolving or highly anomalous ENSO conditions (in fact, it’s likely the PDO will begin rising in the coming months as the effects of the current El Niño become integrated in the longer-term average). ENSO is, in itself, a true physical semi-periodic oscillation, and can on its own exert a profound causal influence on global climate for 6-12+ months. During an extreme El Niño event, like this year’s it’s quite likely that the ENSO signal will overwhelm whatever lagged effects of prior ENSO events (and assorted varaibility) are embedded in the moderately negative PDO.
Personally, I am actually more intrigued by the potential for a less-discussed upper-atmospheric cycle, the Quasi-Biennial Oscillation (QBO), to reinforce the effects of this year’s historic El Niño event. The QBO represents the reversal (from west to east and vice versa) in the direction of winds in the stratosphere in the tropics, so named for its ~28 month periodicity. When the QBO is in a westerly (positive) phase, a straighter, more consolidated zonal jet stream is favored (as opposed to a wavier jet during QBO easterly phases). As such, positive QBO phases tend to reinforce the strengthened and eastward-shifted northeastern Pacific jet favored by strong El Niño events. This year, the QBO will be in its westerly (El Niño teleconnection-amplifying) phase; it is possible this is why this year’s seasonal model predictions are so remarkably wet for California. And to top it off, this year’s El Niño event is already centered farther east in the tropical Pacific than any previous historical event as of October, and that record-breakingness is expected to persist into winter; multiple historical studies suggest that strongly east-based El Niño events exert a larger and more consistent influence on California hydroclimate than do others.
And finally, what does all of this mean in the context of global warming? Well, the entire planet is already around 1.5°C (2.7F) warmer on a long-term basis due to human-caused warming, accelerating the hydrologic cycle by >10% so far; a record-strength El Niño could add another 0.3°C (0.5F) on top of that just this year (with much larger local anomalies). That will greatly increase odds of record-breaking global temperatures into 2027, and also further accelerate the global hydrologic cycle. Additionally, temporarily increased sea levels from El Niño along the California coast sit atop a climate-changed baseline that is already 6-10 inches higher than a century ago; there will be places that flood along the coast this winter that would not have done so, a century ago, even during an El Niño of this magnitude, as a direct result.
Live virtual weather & climate office hour: The big October El Niño update
On Tuesday, October 13th at 1pm PT, I’ll offer a solely El Niño-focused update via YouTube livestream. It’ll cover many of the same topics in today’s blog post, but with greater depth, and as always I’ll be answering questions from the participating audience drawn from the live chat. See you there! (This livestream will be recorded and made available immediately after the live portion ends, in case you aren’t able to join at 1pm!)
The post El Niño, already near/at record intensity, will further strengthen to historic level and likely bring major California & SW U.S. winter impacts first appeared on Weather West.