This story was originally published by EdSource. Sign up for their daily newsletter.
Top Takeaways
- COVID broke momentum for the new Next Generation Science Standards, and plummeting math and reading scores dominated attention coming out of the pandemic.
- Now that the State Board of Education is adding science test scores to the state dashboard, science advocates see an opening to prove that science, taught right, will enrich learning and can raise achievement.
- But first, they say, the state and schools must invest in training teachers in what they’ve been missing.
Short of dropping a dead weight copy of the state Education Code on your foot, a State Board of Education agenda item on the California School Dashboard normally wouldn’t evoke tears.
But Jessica Sawko’s tears earlier this month were spontaneous and heartfelt during her one-minute testimony before the State Board of Education. They expressed joy and relief over a win for science education a long time coming.
New student growth metric
California has lagged behind other states in adopting a method of tracking students’ growth in test scores. Critics are panning its debut in California. See section below.
Beginning with the release of scores this fall, science scores will be a full-fledged metric on the state school dashboard. Science joins English language arts, math, suspension rates, chronic absences and other measures given equal weight on the state’s school accountability site. This will end a decade long campaign by science educators to give the subject equal standing in the School Dashboard.
Sawko, director of education for the advocacy organization Children Now and the California STEM Network, wore a pair of Next Generation Science Standards earrings — a favorite among science teachers when standards were adopted a decade ago. As she thanked the State Board and Cindy Kazanis, who’s in charge of state testing for the Department of Education for “their commitment to science,” her voice cracked, “I’m sorry, I’m emotional. It’s been like a decade.”
In 2013, along with two dozen states, the State Board of Education adopted the new science standards, known by its acronym NGSS. Six years later, California began giving a new science test to students in fifth and eighth grades and one year during high school.

Sawko and her colleagues have felt the sting of neglect. Science didn’t receive the funding for teacher training that math and English language arts received after the adoption of the Common Core standards.
Persuading districts to take the standards seriously has proven a tough sell.
“In 2016, it was a high priority for the California Association of Science Educators that science remain a part of the accountability system, recognizing a clear tie between accountability and investment,” Sawko, who was executive director of the organization at the time, told EdSource. “Children Now also championed that same idea.”
The State Board adopted the science curriculum framework, providing advice to teachers on how to teach NGSS, in 2016, and approved a list of textbooks and teaching materials in 2018. It also put a bookmark for including science on the dashboard in the future. Students took the first CAST assessment in 2019.
Post-pandemic struggle to regain momentum
But any early momentum stalled when the COVID-19 pandemic hit in 2020. Hands-on science instruction, fundamental to NGSS, especially in elementary and middle school grades, faltered during remote learning, and California suspended statewide testing for two years.
When students returned to the classroom, many districts focused on raising fallen math and reading test scores. Meanwhile, the State Board focused on adopting a new math framework and materials, and Gov. Newsom made early literacy reform a major initiative of his second term.
“You know the saying, ‘What’s tested gets taught,’ ” said Peter A’Hearn, a past president of the state science educators association. “We’ve always run up against sort of administrative indifference to science and to putting investment into science and professional learning in science because it hasn’t been one of the tested metrics.”
For the past two years, California Science Test or CAST scores have appeared on the California School Dashboard “for informational purposes” only while the state Department of Education collected the three years of data required to elevate science to the state’s accountability system. In 2029, the state board will decide how to integrate science test scores and a new method of measuring student academic growth into a revised Statewide System of Support for determining which schools and districts need guidance and more intensive assistance.
Science education advocates hope the higher profile for science will make it a higher priority in districts’ budgets and in their chief academic planning document, the Local Control Accountability Plan. But they’re also betting NGSS, given the chance, will prove to be the secret sauce of learning — that elementary teachers will view science not as a competitor with math and reading for instructional time, but as a partner to their success.
“I’m thrilled to see science on the dashboard,” State Board member Haydee Rodriguez, a multi-subject teacher at Central Union High School District in Imperial County, said at the State Board’s meeting on July 8. “The skills that young people learn from science, the habits of mind, are so powerful, whether (or not) they become scientists,” she said. “To see the world of wonder and awe fills me with joy.”
Unlike traditional science instruction, NGSS incorporates hands-on learning that encourages students to apply scientific reasoning and the skills of inquiry and observation to the everyday world. Along with content knowledge, it stresses common patterns, relationships and cause and effect among the sciences — what it calls cross-cutting concepts. Students learning about El Niño, for example, might study the physics of ocean currents, the chemical changes in the ocean and the effect on plants and animals.
The two-hour computer-based California Science Test reflects that approach and includes several performance tasks that require analyzing data and applying scientific reasoning to real-world scenarios. An example of a performance task for third graders might involve creating models for the phases of the moon, said Megan Smith, STEM coordinator for the San Joaquin County Office of Education. Students, perhaps with younger siblings, would sketch the moon over the course of a month, then replicate what they observed in the classroom using a ball and a flashlight, and explain the moon’s orbit.
Because elementary schools often devote limited instructional time to science, “NGSS authors were careful to focus scientific practices with overlapping literacy and math practices,” said Megan Taylor, chief teaching and learning officer for the Exploratorium in San Francisco, which runs a summer institute and year-round professional development programs for California teachers.
The disruptions precipitated by COVID also have created an opening, Taylor said, “a recognition that science practices and ways of thinking are through lines to helping learning happen — and way more fun.”
Advancing NGSS will require intensive teacher training, with a different mindset for classroom instruction. But there must also be dedicated instructional time and access to high-quality instruction, the science teachers association wrote in a 2025 paper, Strategic Investment in Science.
Data are scarce, but a 2022 survey by the association found that only 55% of school districts had purchased NGSS curricula and materials.
Low test scores out of the block
Scores on the CAST underscore the inattention to NGSS. In 2024-25, 32.7% of students were proficient on the test, compared with 37.3% proficiency in math and 48.8% in English language arts.
In 2018-19, the first year of the science test, 29.9% of students were proficient.
The disparities among student groups by race, income and parent education in science also repeated the vast inequalities found in the math and English language arts scores:
- 18.6% of children whose parents had a high school degree were proficient in science compared with 43.9% of children whose parents graduated from college.
- 51.3% of non socioeconomically disadvantaged students were proficient compared with 22.3% of socioeconomically disadvantaged students.
- 60.8% of Asian students were proficient compared with 17.1% of Black students.
Low test results notwithstanding, behind the scenes, science advocates and educators have laid the foundation for the next stage.
Backed by foundation funding, a partnership of the California Department of Education and the Los Angeles County Office of Education created Atlas, an extensive online library of teacher-generated performance tasks for science teachers to adopt in all grades and subjects.
Using $50 million in state funding — the first major state investment in science education — the California Mathematics, Science, and Computer Science Partnership has created networks of professional development and teacher collaboration that have reached all 58 counties, said Smith of the San Joaquin County Office of Education, which is managing the project.
The Exploratorium and the Lawrence Hall of Science in Berkeley are national leaders in supporting science teachers with training and resources. The nonprofit Ten Strands in the Bay Area is advancing climate literacy with high school students and organizing them to create climate-resilient environments.
“There’s a great deal of professional learning support available to educators,” Sawko said. “It’s really a matter of whether or not school districts are supporting their education.”
Sawko and other advocates will seek further funding when the $50 million grant runs out in June 2027.
CALIFORNIA SCHOOL DASHBOARD
New way to measure growth on test scores stirs criticism
Along with science, the State Board voted last month to add another dashboard indicator that the California Department of Education has studied on and off for a decade — a measure of students’ growth on test scores.
But the version that the board introduced last year and reapproved again for releasing this fall – not for accountability purposes – is facing sharp criticism for overstating improvement. The presentation on the dashboard “may cause confusion or even give a misleading understanding of student progress,” the nonprofit student advocacy organization GO Public Schools wrote in a guide to the dashboard (see pages 30-34).
Growth data measure how assessment scores have increased between the current and previous years and how that growth compares with students’ average growth statewide (see state toolkit on growth). It can be used only for math and English language arts in grades four through eight in California, because students aren’t tested annually in science, and only once in high school.
California has been one of only two states without a growth measure for standardized tests, according to an analysis for Getting Down to Facts by USC education professor Morgan Polikoff and Arizona State University researcher Shira Haderlein.
California has relied on a different method to measure yearly increases or declines on the dashboard. It compares the Smarter Balanced scores of the current year’s fourth graders with the students in last year’s fourth grade. This method is limited because it compares two different sets of children, and in some schools, the yearly student transfer rate is high.
Student growth data are useful because they can reveal whether students are falling behind or catching up over time in which schools, demographic groups and grades. Starting this year, for example, California charter schools that argue students enter school grade levels behind but make big gains over time, even if they haven’t reached proficiency, will be able to use growth data to support their case for school renewal.
Calculating growth can be complex, and states have chosen different models. One method, pioneered by Louisiana, lets parents see how many points on the test scale their fourth grader is from the proficiency level in math in sixth grade. That often can be a better indicator than grades of what it will take to reach proficiency over two grades.
California has chosen a method called the residual gain model. It begins by looking at each student’s individual point score last year on a Smarter Balanced test and calculates the average yearly gain for all students who had that same score. The same process is then repeated for students by points on the test scale, and finally calculating a statewide average gain.
The state then compares average scores of every school, district and student group with the statewide average and rates them on how many points they fall below or above average. Level 3 is in the middle range of five ratings; Level 5 is at the top, for 20 or more points above average and Level 1, minimal, for 20 or more points below average.
The state has collected the data for three years, but the results won’t appear on the dashboard this fall; those who are interested have to download a massive data file.
“We are just frustrated that the state isn’t reporting the data from the growth model that they painstakingly designed on the dashboard, and instead requires districts, schools and parents/community groups interested in growth to download the data file (and then extract from that file growth data for their school or district,” said Rob Manwaring, senior policy adviser for Children Now.
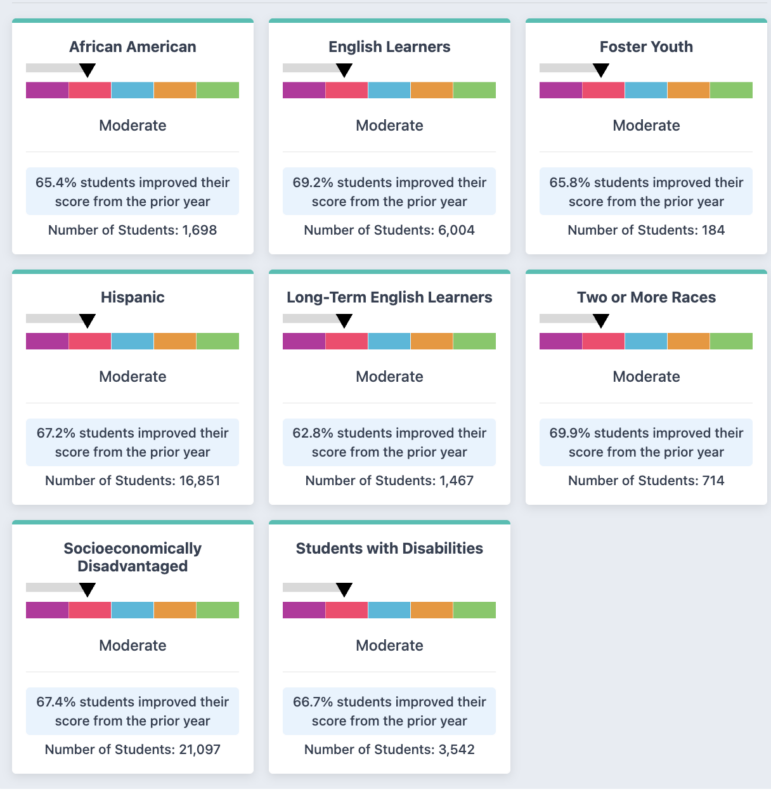
Instead, it is displaying a puzzling alternative. It is comparing schools, districts and student groups by the percentage of students whose scores increased from the previous year – with an increase defined as a single scale point. Then it rates those percentages with a color rating, using different colors than assigned to other dashboard measures. Schools with a 75% increase were rated average, while a 62% increase was rated “moderate” or Level 2.
“Many schools and districts appear to have very high percentages of students making progress, even when other indicators show little or no improvement,” wrote GO Public Schools. “This overly rosy picture could reduce a sense of urgency to make necessary changes to better serve students.”
David Wakelyn, a partner at Upswing Labs, which researches efforts to improve literacy achievement, and a former middle school English teacher in Inglewood, elaborated on that point in an email: “A 1-scale-score point gain between 3rd and 4th grade represents 4 days of learning. Would any normal human celebrate that if it’s what was accomplished in a school year???”
“Celebrating 1 point of scale score growth when kids need 25-50 scale points damages the Board’s credibility and misses the opportunity to be honest about what struggling kids need to succeed,” he wrote. “No one is well-served by it.”
“No other states use a metric of students who made a one-point scale score gain as their indicator,” said Manwaring.
Asked about the criticism, the Department of Education responded in an email. “We have heard the concerns raised and the SBE has asked CDE to revisit the design of the Dashboard Growth Data Cards to include this scale score point metric (average scale score above/below predicted) for the 2027 Dashboard, following public feedback received.”
The department will issue a memo, probably in August, summarizing its plans.
– John Fensterwald