The Education Recovery Scorecard lets you find both districts whose test scores are back to or above pre-pandemic levels and those struggling grade levels behind.
A unique database that enables people to compare standardized test scores among nearly all districts and states found that California experienced slightly less learning loss than the national average in the four years following the 2020 pandemic.
The Education Recovery Scorecard, which researchers from Stanford University, Harvard University and Dartmouth College developed, also identified those districts that have escalated learning recovery and those that had fallen farthest behind.
Those whose test scores improved in either math, reading or both, include Compton Unified and Monterey Peninsula, both with high proportions of low-income students, as well as Chino Valley Unified and Bonita Unified, whose students gained nearly a half-grade level of learning compared with pre-pandemic 2019.
The Associated Press, in conjunction with the researchers, published Tuesday a wealth of information from 43 states with 8,718 districts for which data was available, including the nearly 1,000 districts in California. They affirm what other analyses of states and the nation have found: The decline in scores in both reading and math, as a result of the pandemic, was severe.
Although no state reached their pre-pandemic scores in both math and reading, many individual districts did. The scorecard found that 31% of California students attended districts scoring above 2019 levels in math, with 12% of students in districts scoring above 2019 levels in reading, and 10% in districts that have recovered in both.
That’s significantly higher than the national average: Only 17% of students nationally in grades three to eight are in districts whose average math score on the scorecard was above that of 2019.
However, keep in mind that California had much more ground to make up. In 2019, California’s average score in math was already half a grade behind the national average. While in 2024, the gap between California and the nation had narrowed to 36% in math, scores nationally and in California both had lost ground. As a result, California’s 2019 score in math was 82% of a year of learning below the 2019 national average.
Some of the biggest districts, including San Bernardino City, Long Beach and San Juan remain more than half a grade equivalent behind in math from five years before.
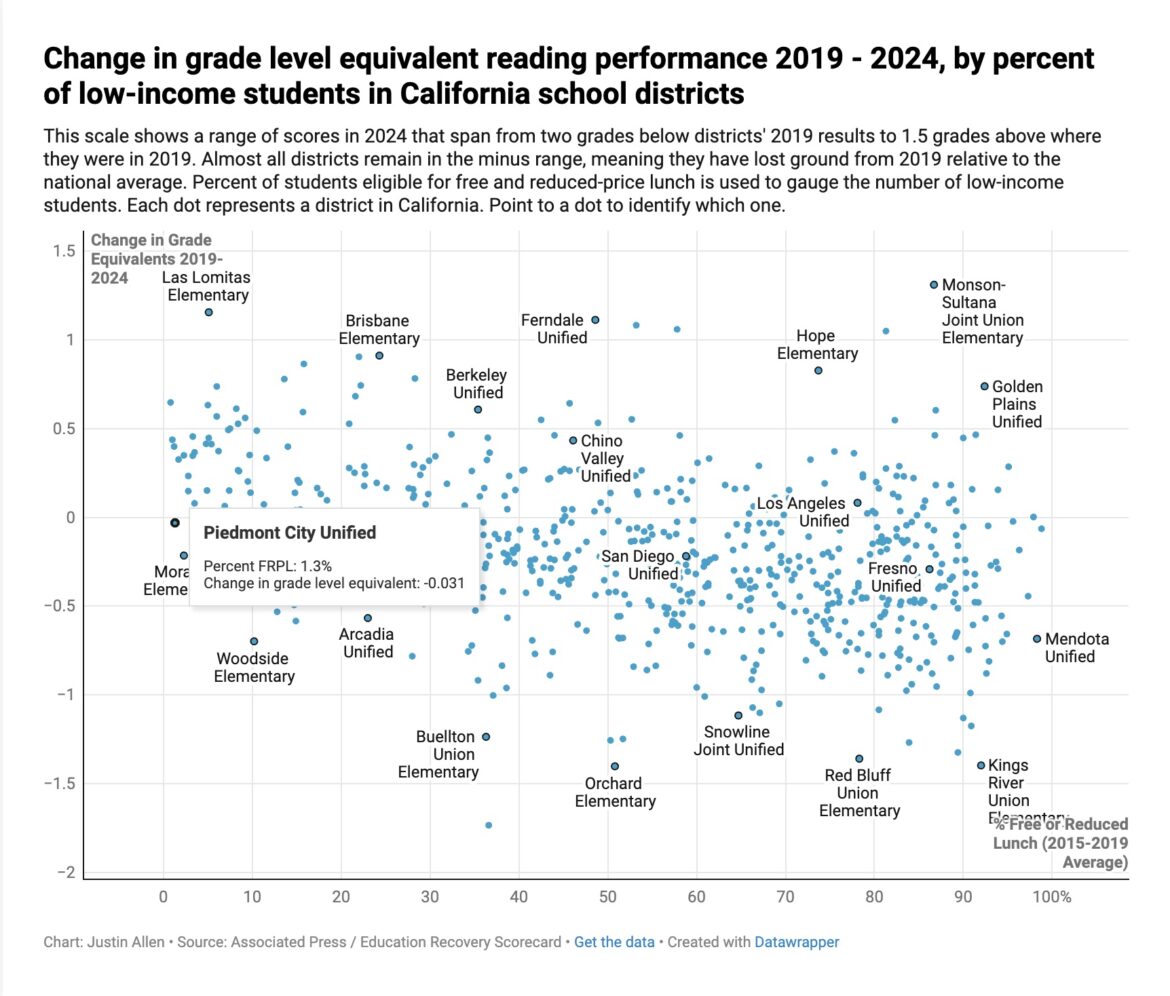
Reading scores followed a similar trend. In 2019, the gap between the nation and California was 29%; in 2024, it had narrowed to 22%, yet had dropped to 69% of a grade below the 2019 national average.
As the state’s two largest districts with nearly 10% of California’s enrollment, Los Angeles and San Diego may have lifted the state’s overall average. Los Angeles in 2024 was within a few percentage points of its 2019 scores in reading and math; San Diego’s pandemic decline was significantly less than the state’s.
The scorecard makes comparisons possible on a single scale based on percentages of an expected year of growth. It equalizes states’ scores by aligning them to their results on the National Assessment of Academic Progress (NAEP), the common test that a representative sample of students in all states take every two years.
Going Deeper
The Associated Press analyzed data from the Education Recovery Scorecard, produced by Harvard’s Tom Kane and Stanford’s Sean Reardon, which uses state test score data to compare districts across states and regions on post-pandemic learning recovery. The AP provided data analysis and reporting for this story.
Researchers from Stanford, Harvard and Dartmouth created the Education Recovery Scorecard using a longitudinal database developed by the Stanford Graduate School of Education. Because states use different tests with different measures for determining what constitutes proficiency, apples-to-apples comparisons of learning losses and gains across the nation normally can’t be made. Some states’ scores for proficiency are “easier” to achieve than in other states.
The scorecard affirmed trends that others have found by analyzing NAEP and California’s Smarter Balanced scores and results nationally.
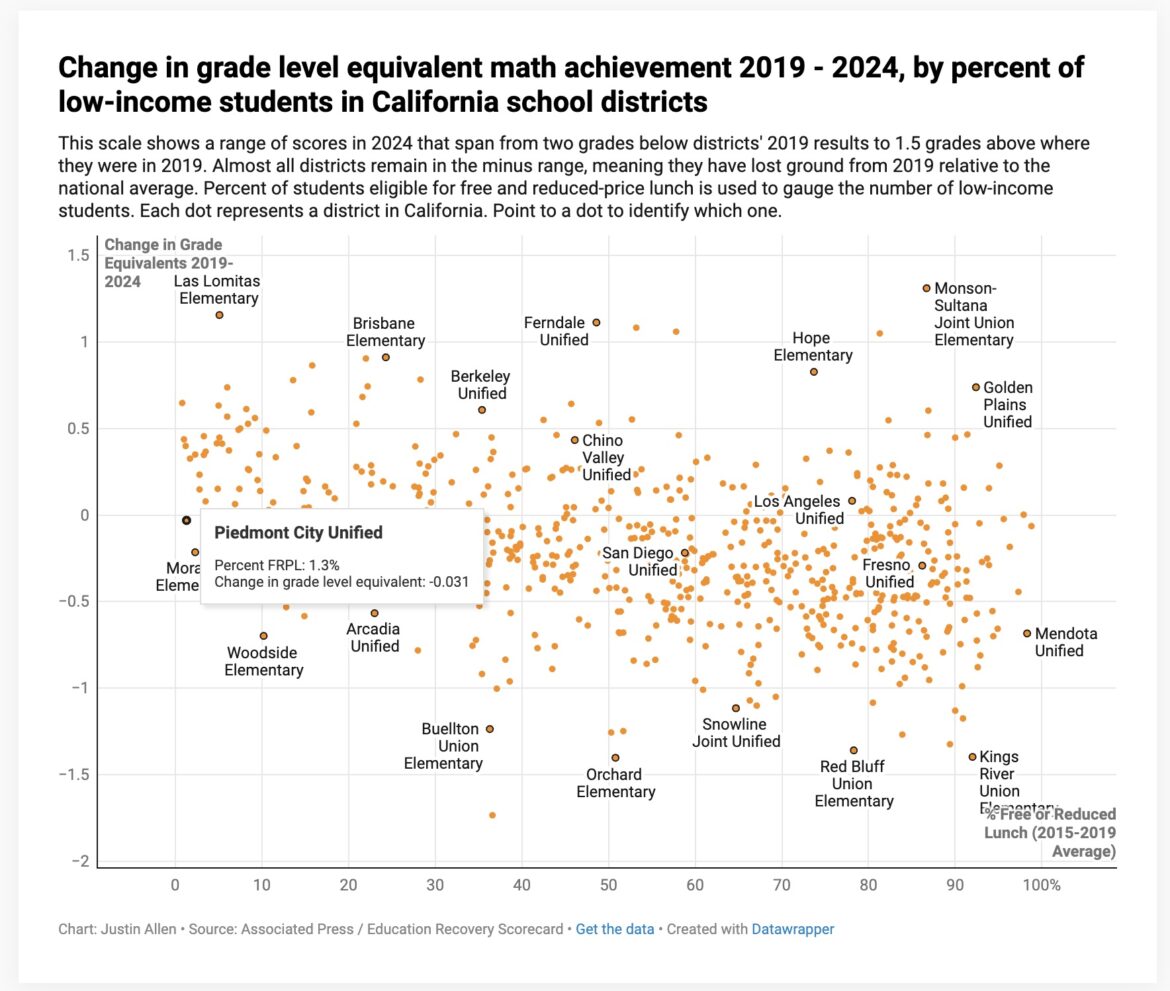
- Achievement gaps by income and race and ethnicity widened during the pandemic. The highest-income districts were nearly four times more likely to recover in both reading and math than the lowest-income districts. The disparity in math scores between students in affluent and low-income districts grew by 11% since the start of the pandemic; the disparity in scores between students in predominantly non-minority and predominantly minority districts grew by 15%.
- High rates of absenteeism, especially in high poverty districts, have slowed recovery. One of the report’s recommendations is to recruit mayors, employers and other community leaders; total responsibility shouldn’t rest with schools, the report said. Help could include launching public information campaigns, funding extracurricular activities to draw students to school; and assisting with transportation, the report said.
- Federal Covid relief for schools, especially $122 billion from the American Rescue Plan passed in 2021, appeared to stem even bigger learning losses in the higher poverty districts — by about 10% of a grade equivalent. But how districts spent the money mattered. In examining federal spending in California, which required more extensive reporting on expenditures, researchers found that spending on intensive tutoring and after-school and summer school programs tended to yield the most effective results.
“The slide in average NAEP scores masks a pernicious inequality: Scores have declined far more in America’s middle- and low-income communities than in its wealthy ones. The good news is that it could have been worse: The federal investment in public schools during the pandemic paid off, limiting academic losses in high-poverty districts,” professor Sean Reardon, faculty director of the Educational Opportunity Project at Stanford and a lead researcher on the scorecard, told the AP.
Along with Compton Unified, whose impressive improvement started before Covid and was undeterred by it, Bonita Unified, a 10,000-student district where 36% of students are eligible for free or reduced meals, raised both reading and math scores to a third of a grade level above 2019 results. In a letter to parents, Bonita Superintendent Matt Wien praised “the sense of purpose that is felt throughout the district and drives our students and employees alike.” He also pointed to hiring elementary school intervention teachers and comprehensive instruction during summer programs.
Chino Valley Unified scores rose in 2024 to 43% of a grade above 2019 in math and 34% in reading. Deputy Superintendent Grace Park cited the collaboration of teacher teams that developed an essential set of learning standards in every grade, followed by designing lessons and assessments, then monitoring their effectiveness. She also noted that the district was the first in San Bernardino County to return to the classroom when the pandemic eased.
Economist Tom Kane, faculty director of the Center for Education Policy Research at Harvard and a collaborator on the scorecard, said it is essential for districts to apply lessons of the recovery. He and Reardon stressed focusing on which of the “science of reading” reforms that districts have tried most improved early literacy.
“The rescue phase is over. The federal relief dollars are gone. It is time to pivot from short-term recovery to longer-term challenges such as reducing absenteeism and addressing the slide in literacy,” Kane said.
One advantage California has is a $6.8 billion pot of state money that is replacing the expired federal Covid funds. Distributed based on districts’ low-income enrollment, districts can use the Learning Recovery Emergency Block Grant through 2027-28 on tutoring and other research-proven strategies, along with mental health and student well-being. The funding is a second chance.